Survey Report: 80 percent students worry about the cost of education
Team Careers360 | March 30, 2020 | 11:30 AM IST | 5 mins read

NEW DELHI: Over the past few issues and even online, Careers360 has covered the spurt of protests against fee hikes. The cases of specific public institutions have been illustrative of a large and growing problem –government funds are no longer matching what’s required. However, few institutions have student bodies that are organised and proactive enough to resist or draw attention to their plight. But we know, if only anecdotally, that degrees have become dearer everywhere, jobs are harder to come by and thousands of students pursuing different degrees in a wide variety of institutions are struggling.
Apart from trying to understand how many are finding college education expensive, the first edition of The Big Qs survey attempts to shed light on the nature of their struggle – how they manage, what their social life may look like, what sort of support they receive from teachers.
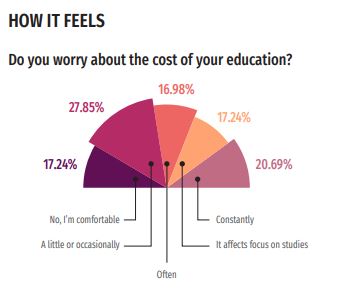
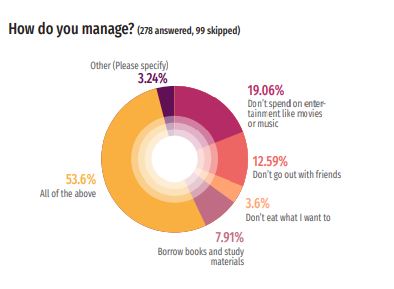
What we found is sobering: over 80 percent students surveyed reported they worry about the cost of their education and for over 20 percent, the stress affects their focus on studies. Of those who experience financial pressure, over half said they don’t spend on entertainment, don’t go out with friends, forego food they want to eat and borrow textbooks. Around 40 percent students or families are in debt or have sold assets and this includes ones who are studying general disciplines such as commerce and sciences.
We hope to make The Big Qs a regular feature and future editions will look at other aspects of student life. The report for the present one – also the first – is given below. The first section details what was asked and the sources of the responses – the courses, their geographical spread and gender. The second explains the questions asked. The third gives the percentage distribution of responses to each question. And the final section presents further analysis correlating the practices and experiences of students to the other facts of their situation.
1. Survey and respondents
Excluding the ones on email address and gender, the survey asked 13 questions. These covered family income, the fee for a programme, the cost of accommodation and food and availability of financial aid. But apart from the costs involved, they also sought information on how financial stress affects students and how they manage.
The survey was conducted online and was open to undergraduates in degree programmes only. Apart from email addresses, we did not collect any personal information, not even the names of the institutions they attend.
We started reaching out to students from February 1. The survey was emailed to the relevant group from Careers360’s own database of students and also publicised through the magazine’s official social media accounts and those of some of its staff. The survey link was also privately circulated among a few student groups on messaging services. The survey was closed on February 21 allowing for 20 days to gather responses.
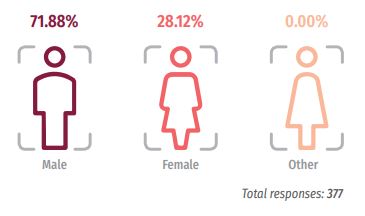
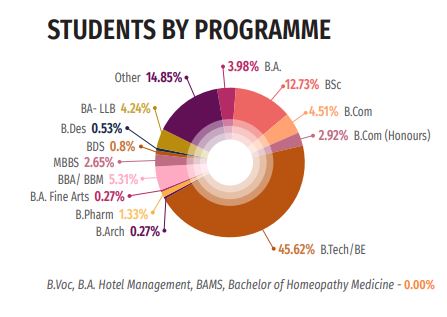
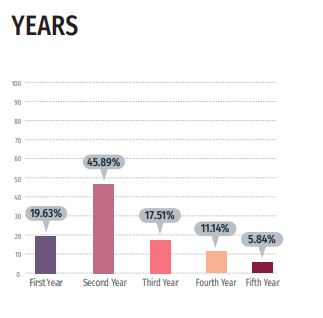
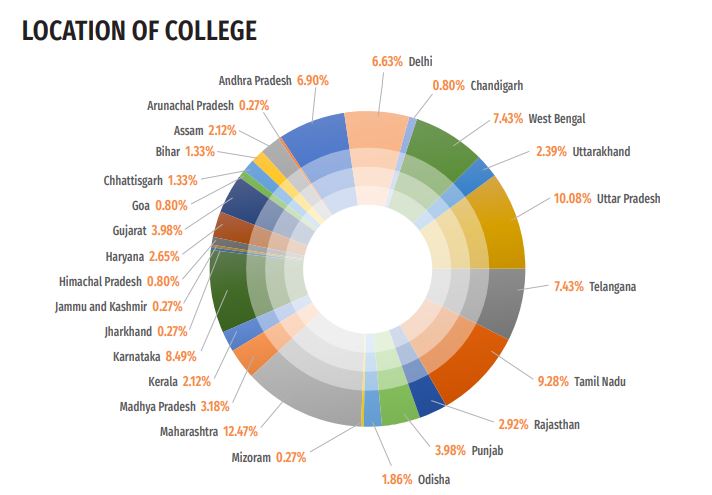
At total of 377 students from across the country took part in the survey and their courses and years of study were factored in. However, the bulk of the responses came from students pursuing B.Tech degrees and colleges in Maharashtra, Karnataka and Andhra Pradesh. While the bias towards engineering could be due to Careers360’s long-term engagement with professional courses through a range of products and programmes, the geographical skew could be a reflection of the uneven distribution of colleges offering professional programmes across the country. In another skew, the number of responses from women students is less than 40 percent of the total.
Given below is the distribution of responses by gender, programme, year of studies and location of the college.
2. The questions
The questions can be broadly divided into two categories. One set sought facts – income, fees, costs. The other one sought information on more subjective matters – managing finances, experience of stress, discrimination.
Under each question, multiple answer choices were given and depending on the question, respondents were asked to pick one or skip. Where “Other” was one of the choices, they were invited to explain in more detail but most did not. A few of those who did also commented on their colleges and lives in general.
The “Other” option was available for five questions and these are the numbers of respondents who selected it:
- Q No.3 | Choose your programme | 56
- Q No.7 | Do you stay away from home? | 13
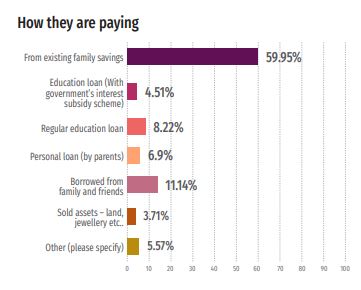
- Q No. 12 | How are you paying for your education? | 21
- Q No.14 | How do you manage? (Skip this if you feel no financial pressure) | 9
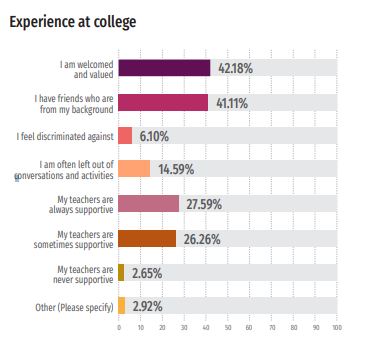
- Q No.15 | Tell us your experience in college | 11
The option to skip was available for three questions. The numbers to skip are given below:
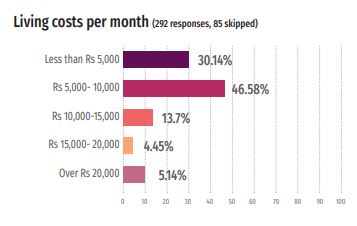
- Q No.10| If you are staying away from home, what are your living costs per month? | 85
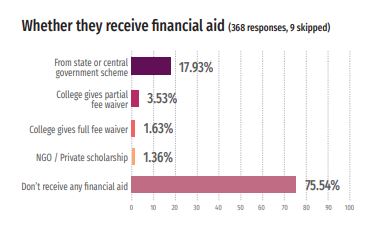
- Q No.11| Do you receive financial aid? | 9
- Q No.14| How do you manage? (Skip this if you feel no financial pressure) | 99
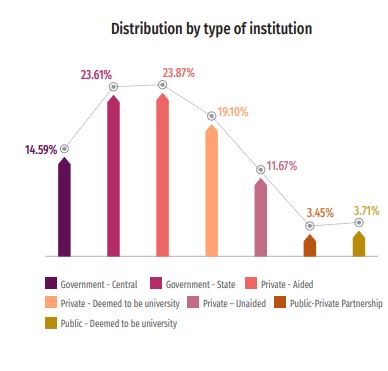
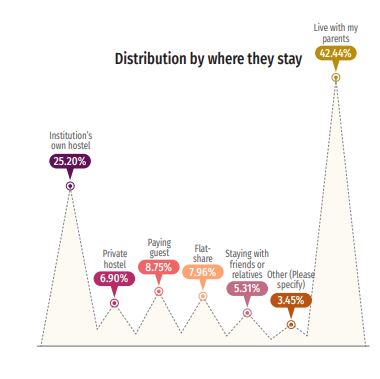
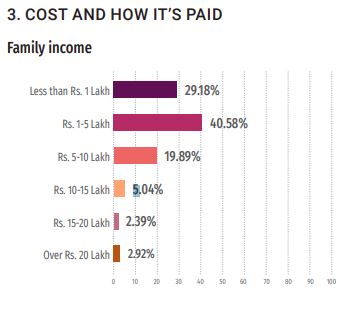
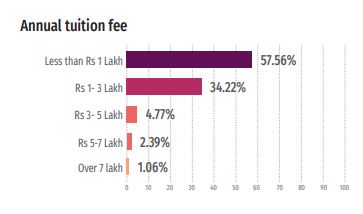
3. The answers
The percentage distribution of answers is given for each question.
4. Further analysis
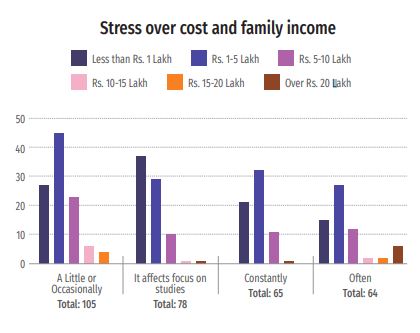
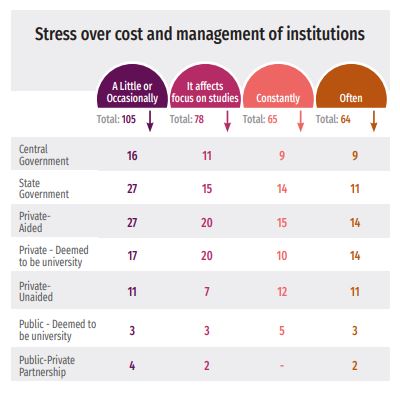
- To begin with, data on the experience of financial strain was correlated with that on family income and type of institution. Predictably, those from the lowest income brackets in the survey experienced more stress. Less predictably, the group of students worrying about how much they are spending is spread pretty evenly over public and private institutions.
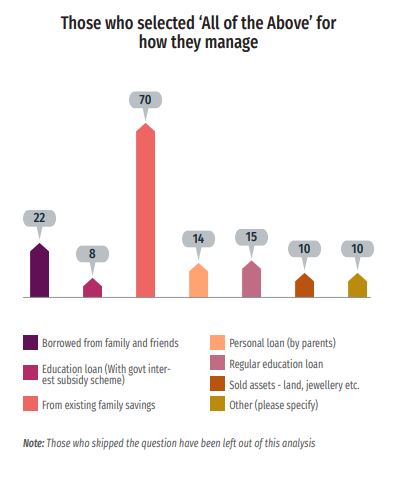
- Next, the situation of students who practised all the different ways of saving up was studied. How the 149 students who selected “All of the above” for the question on how they manage are paying for their courses was examined. Those who had skipped the question (99) were left out of this.
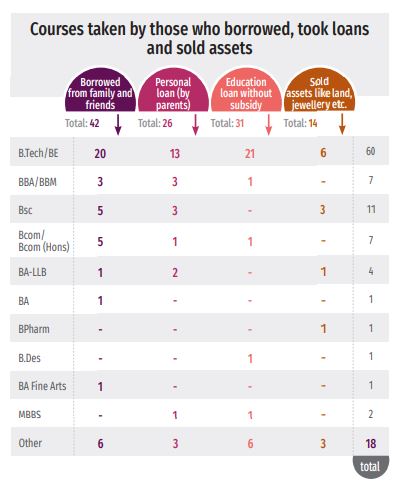
- Which courses students’ families were borrowing and selling assets for were also examined and they did not just include professional courses but also ones in general disciplines – BSc, BCom, even BA. Four respondents said they were paying with income from part-time jobs.
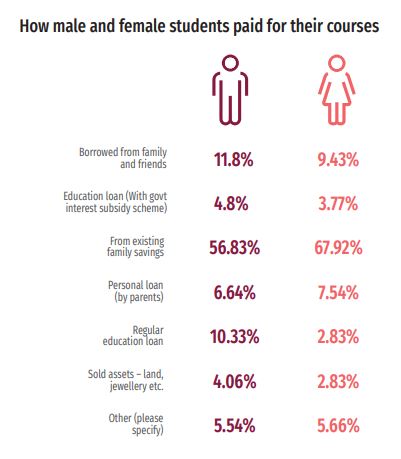
- The number of male respondents was more than double that of female ones. This made it difficult to analyse the responses to some questions – the one on college experiences, for example – from the perspective of gender. However, we looked at how families were paying to educate their daughters and sons.
- Finally, the data on college experiences was correlated with family income.
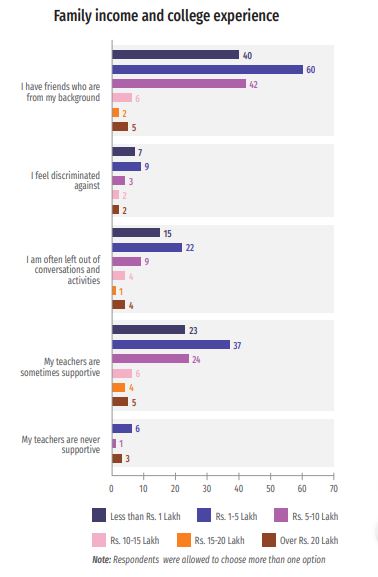
However, an experience could have been due to a host of factors on which the survey did not collect data – disability, sexual orientation, religious identity, language gap and others.
Also read:
- How the turmoil over college fees has been a decade in the making
- Budget too low for excellence in higher education: Parliament Panel
Write to us at news@careers360.com.
Follow us for the latest education news on colleges and universities, admission, courses, exams, research, education policies, study abroad and more..
To get in touch, write to us at news@careers360.com.