35% male dropouts ‘not interested in studies’: What NFHS 5 says about school education
Pritha Roy Choudhury | May 23, 2022 | 01:38 PM IST | 8 mins read
NFHS 5: Health ministry-supported survey found low school attendance among Muslims, very low pre-school participation in Uttar Pradesh.
NEW DELHI: Over a third of male children aged five-17 years who dropped out of school did so because they are “not interested in studies”. A large section of girls drop out due to lack of interest as well but there are other major factors for them – household work, marriage, school being set far from home.
The fifth round of the National Family Health Survey (NFHS 5) also revealed that Muslim children have the lowest attendance ratio in secondary school; Uttar Pradesh sends just 15 percent children to pre-school; and, despite a law making elementary school education free and compulsory, the net and gross attendance ratios for school continue to be low among minority children and those from historically-disadvantaged groups – Scheduled Castes, Scheduled Tribes (SC, ST).
The NFHS 5 was conducted by International Institute for Population Sciences (IIPS) as nodal agency, under the aegis of the ministry of health and family welfare (MoHFW). It covered 6,36,699 households, 7,24,115 women and 1,01,839 men, spread across 707 districts in 29 states and seven union territories. Conducted in two phases from June 2019 to April 2021, the survey report was released earlier this month.
This is what the survey found on pre-school and school education.
Also Read | ‘To affirm constitutional politics’: What are DU prof Ratan Lal's posts on YouTube about?
NFHS 5: Children and parents
One or both parents of 8.9 percent of children aged 15-17 years and 6.1 percent children aged 10-14 years had died. Out of 151,240 children in the five-17 years age group, 5.1 percent were not living with a biological parent.
The lowest wealth quintile had the highest number of children with one or both parents dead; the lowest and second lowest quintiles had the highest percentage of children not living with a biological parent – 3.4 percent.
In all, 4.6 percent of children under the age of 18 had one or both parents dead and 3 percent were not living with a biological parent. Sikkim and Mizoram had over 8 percent children who had lost one or both parents; Meghalaya had 7.6 percent and Nagaland 6.5 percent.
Pre-school attendance
The NFHS 5 gathered data on pre-school attendance, for children aged two-four years, for the first time. The data shows that attendance is higher among children of working women and lowest among Muslims.
Also Read | Vedic Maths, Astrology, Anti-Vaxxers: This engineer calls out pseudoscience on YouTube
Children of working mothers
Pre-school attendance of children of working mothers was significantly higher – by over eight percentage points – than that of children of non-working mothers.
The table below shows the percentage of children attending pre-school, by the work status of mothers. While there are wide differences in participation between urban and rural children, the gap between male and female children in both settings was narrow, under two percentage points. For that reason, the chart below presents data by the setting and not gender of the child.
Pre-school attendance and working mothers (In %)
Mothers currently working | Urban | Rural | Total |
Not working | 42.6 | 37.0 | 38.6 |
Working | 50.8 | 45.4 | 46.8 |
Not in the household | 42.4 | 36.2 | 38.0 |
Don't know/ missing / incomplete / no interview | 44.1 | 38.8 | 40.2 |
Also Read: Madrassa word should cease to exist, schools should impart modern education: Assam CM
Muslims had lowest pre-school attendance
Of the six major religions, pre-school attendance was lowest among Muslims with just 33.8 percent of two-four year-olds attending overall. Attendance among urban children was significantly higher than their rural counterparts for all communities except the Christians and the Sikhs where the difference was of less than two percentage points.
Pre-school attendance by religion, location (In %)
Religion of household head | Urban | Rural | Total |
Hindu | 45.8 | 39.5 | 41.1 |
Muslim | 36.7 | 32.1 | 33.8 |
Christian | 48.7 | 47.1 | 47.5 |
Sikh | 42.3 | 40.4 | 40.9 |
Buddhist/Neo-Buddhist | 58.5 | 63.3 | 61.7 |
Jain | 68.9 | 56.7 | 65.5 |
Others | 40.0 | 31.8 | 33.2 |
However, in this case, there were significant differences in attendance between male and female children among Christians, Buddhists and Jains. The difference is most pronounced in the case of rural Buddhists and Jains. Pre-school attendance among rural Buddhist children was 71.9%, much higher than the 55.8% among their urban counterparts. The Jains displayed the opposite trend with 63.4% attendance among urban children and 49 percent among rural ones.
Pre-school attendance by religion, gender (In %)
Religion of household head | Male | Female | Total |
Christian | 45.7 | 49.3 | 47.5 |
Buddhist / Neo-Buddhist | 55.2 | 68.6 | 61.7 |
Jain | 69.1 | 61.4 | 65.5 |
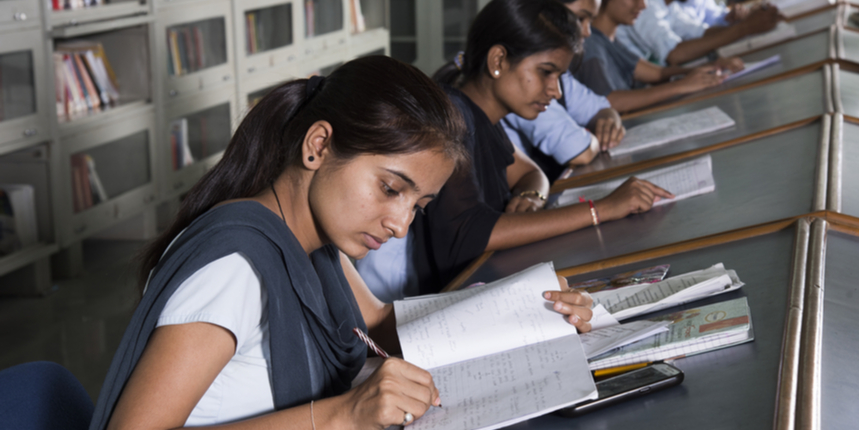 Girls Education: Christians, Buddhists, Jains showed the widest gender gap (Image: Shutterstock)
Attendance among SC, ST, OBC
The historically-marginalised Scheduled Castes (SC) have the lowest overall pre-school attendance, followed by the Other Backward Classes (OBC). Pre-school attendance among Scheduled Tribes (ST) is comparable to those of children from the “Others” category which includes the upper castes.
Attendance: SC, ST, OBC, others (In %)
Caste/tribe of household head | Urban | Rural | Total |
Scheduled Caste | 41.7 | 37.1 | 38.2 |
Scheduled Tribe | 44.4 | 48.0 | 43.2 |
Other Backward Classes | 42.9 | 36.2 | 38.1 |
Others | 46.7 | 42.8 | 44.3 |
Don't Know | 46.5 | 43 | 44.2 |
Also Read | Mid-day meal dispute resolves in Champawat's school
Uttar Pradesh: Lowest pre-school attendance
Among the larger states, Andhra Pradesh, Telangana and Maharashtra had the top pre-school attendance rates for two-four year-olds. Uttar Pradesh, where just 15.1 percent of the children attend, was at the bottom.
Pre-School Attendance: Top 5 states (In %)
State, UT | Urban | Rural | Total |
Andaman & Nicobar islands | 98.6 | 81.3 | 88.5 |
Andhra Pradesh | 74.5 | 75.8 | 75.4 |
Sikkim | 78.7 | 71.1 | 74.2 |
Telangana | 65.6 | 71.3 | 69 |
Maharashtra | 60.9 | 70.4 | 66.2 |
Of all states and union territories, small and large, UP is at the bottom. The pre-school attendance of its rural children is the lowest in the country at 14.3 percent, behind Nagaland. Even among its urban children, attendance was below 20 percent – the only state with such a record.
Pre-School Attendance: Bottom 5 states (In %)
State, UT | Urban | Rural | Total |
Uttar Pradesh | 17.9 | 14.3 | 15.1 |
Nagaland | 23.9 | 15.8 | 16.4 |
Arunachal Pradesh | 32.3 | 23.4 | 24.6 |
Jharkhand | 30.5 | 23.7 | 24.9 |
Chandigarh | 26.9 | 0.0 | 26.5 |
Also Read: Ensure no internship fee is charged from medical graduates; give stipend to FMGs: NMC
Years of schooling
The majority of male youths aged 20-24 years and, therefore, past the school-going age, had actually completed school. Among men of that age, 52.8 percent have completed 12 or more years of school. Among women, that figure was less than half – 47.1 percent.
But worryingly, 38.2 percent of women and 32.9 percent of men in that age group had completed nine or fewer years of school, implying that they dropped out. However, the percentage of children or youth with no schooling is lower in the younger cohorts in the same survey, showing an improvement in enrollment and retention.
Of all the states and UTs, Chandigarh and Goa had the highest median number of years of schooling (9.1) followed by Kerala (nine) and Lakshadweep (eight). The lowest was Bihar’s (two), Jharkhand (3.4) and Telangana (3.4).
The Right to Education Act was passed in 2009 and implemented in 2010, making elementary education for six to 14 year olds free and compulsory. However, even as late as 2019-21 when the survey was conducted, 2.3 percent of 10-14 year-olds had had no schooling at all.
Years of Schooling: Age 20-24 (In %)
Years of schooling completed | Female | Male |
No schooling | 8.6 | 4.5 |
< 5 years | 3.0 | 3.0 |
5-7 years | 9.6 | 8.6 |
8-9 years | 17.0 | 16.8 |
10-11 years | 14.7 | 14.2 |
12 or more years | 47.1 | 52.8 |
Don't know / missing | 0.0 | 0.1 |
Total | 100.0 | 100.0 |
Median | 10.0 | 11.2 |
Also Read | Health plan, toilet ratio, admission guidelines in Kerala’s ‘School Manual’
School completion by religion
The median years of schooling completed is lowest among Muslims and highest among the Jains.
Years of schooling and religion
Religion | Median years of schooling completed |
Hindu | 7.5 |
Muslim | 5.4 |
Christian | 7.9 |
Sikh | 7.8 |
Buddhist / Neo-Buddhist | 8.2 |
Jain | 11.1 |
Other | 6.0 |
School completion by caste
Among the castes, the “other” bracket – including the upper castes – had the highest median number of schooling completed. It was lowest among the tribal populations and those who said they didn’t know which caste they belonged to.
Years of schooling
Caste | Median years of schooling completed |
SC | 6.5 |
ST | 5.2 |
OBC | 7.3 |
Other | 8.5 |
Don’t know | 5.1 |
6-17 year-olds in school
Despite the RTE Act being around for a decade, elementary education (Classes 1 to 8) is still not universal – 93.3 percent of children in the six-14 age group which the RTE covers were attending school. Attendance at the primary level, Classes 1 to 5, was 94.8 percent but dropped to 93 percent at the upper primary level or Classes 6-8. It drops further at the secondary level (Classes 9 and 10) and plummets to just 65.2 percent at the higher secondary level, Classes 11 and 12.
Going to school
Age group | Attending School (In %) |
6-10 Years (Primary) | 94.8 |
11-13 Years (Upper Primary) | 93.0 |
14-15 Years (Secondary) | 82.4 |
16-17 Years (Higher Secondary) | 65.2 |
Kerala had the highest attendance rate – 98.4 percent – followed by Goa (96.1 percent) and Sikkim (95.2 percent). Attendance was lowest in Uttar Pradesh (81.5 percent) followed by Gujarat (82.1 percent) and Madhya Pradesh (83 percent).
 NFHS 5: UP has the lowest school attendance rate; Kerala, highest
Also Read: Health ministry, NMC mulling scheme to enable MBBS students hit by Ukraine war, Covid study in India
Attendance ratio lowest among Muslims
Muslims had the lowest net and gross attendance ratios in the middle, secondary and higher secondary levels of schooling. The net attendance ratio (NAR) is the percentage of children of official primary-school age actually attending school; gross attendance ratio (GAR) is the percentage of children of any age out of the total population in the official school-going age-bracket. The GAR can be over 100.
Worryingly, the NAR is far below 90 percent even at the primary level for all but the Jain community, all castes and all wealth quintiles. The GAR is over 90 percent for most communities suggesting that the enrollment isn’t all age-appropriate.
School attendance ratio by religion
Religion | Primary (In %) | Middle, Secondary, Higher Secondary (In %) | ||
NAR | GAR | NAR | GAR | |
Hindu | 83.2 | 89.8 | 72.8 | 84.0 |
Muslim | 83.9 | 94.9 | 62.5 | 71 |
Christian | 85.7 | 94.5 | 77.5 | 87.8 |
Sikh | 83.0 | 86.4 | 80.1 | 92.2 |
Buddhist / Neo Buddhist | 87.2 | 93.9 | 83.1 | 94.3 |
Jain | 91.0 | 92.8 | 87.4 | 94.7 |
Others | 82.7 | 95.8 | 66.4 | 74.5 |
The NAR among Muslims at the middle, secondary and higher secondary levels is just 62.5 percent – the lowest of all religious groups – and 65.1 percent among the Adivasis, the lowest of the caste and tribal groups, not counting respondents who didn’t know which group they belonged to.
School attendance ratio by caste
Caste / Tribe | Primary (In %) | Middle, Secondary, Higher Secondary (in %) | ||
NAR | GAR | NAR | GAR | |
SC | 82.3 | 90.9 | 69.2 | 79.8 |
ST | 81.9 | 90.3 | 65.1 | 75.6 |
OBC | 82.7 | 91.3 | 71.8 | 82.9 |
Others | 85.6 | 93.3 | 76.0 | 86.2 |
Don’t know | 84.5 | 91.9 | 62.3 | 71.2 |
Why students drop out
The NFHS 5 also looked at why children aged six-17 who dropped out of school chose to leave. The largest segment – over 20 percent females and over 35 percent males – said they dropped out because they were “not interested in studies”.
Factors that impact decisions to leave school affect male and female students differently.
For example, school being "too far away" is a bigger issue for rural girls than for their urban counterparts or boys. Then, both urban and rural girls are more likely to get drawn into household work. Around 13 percent girls -- as opposed to around 9-10 percent boys -- cited "required for household work" as reason for dropping out. The cost of education is also a bigger factor for girls, both urban and rural and there's over a 4-point difference between the percentages of girls and boys citing it as a reason for dropping out. Then, marriage put a stop to girls’ education but barely impacted the boys,
But the biggest difference is in the group that dropped out because they were "not interested in studies". The number of boys citing this as the reason was 35.7 percent, over 14 percentage points higher than the 21 percent among girls.
Reasons for dropping out of schools (In %)
Reason | Male | Female |
School too far away | 2.3 | 6.2 |
Transport not available | 0.7 | 1.5 |
Further education not considered necessary | 3.7 | 3.8 |
Required for household work | 9.8 | 13.3 |
Required for work on farm/family business | 4.4 | 2.3 |
Required for outside work for payment in cash or kind | 6.2 | 2.5 |
Costs too much | 16.1 | 20.6 |
No proper school facilities for girls | 0.2 | 1.7 |
Due to disaster/ natural calamity | 0.5 | 0.5 |
Not safe to send girls | 0.1 | 2.0 |
No female teacher | 0.2 | 0.2 |
Required for care of siblings | 0.4 | 0.7 |
Not interested in studies | 35.7 | 21.4 |
Repeated failures | 5.3 | 3.9 |
Got married | 0.3 | 6.8 |
Did not get admission | 5.0 | 4.8 |
Other | 8.9 | 7.7 |
Don't know | 0.2 | 0.2 |
Number of children | 20,084 | 21,851 |
In absolute numbers, of those surveyed, more girls had dropped out than boys.
Follow us for the latest education news on colleges and universities, admission, courses, exams, research, education policies, study abroad and more..
To get in touch, write to us at news@careers360.com.